Columnists: Clas-Otto Wene, Professor Emeritus in Energy Systems Technology at Chalmers University

Published on: 13 Jul 2021
A milestone is not a policy document. On IEA’s 2050 net zero roadmap
Some years ago, I made a speech on “Energy Policy in Sweden 1767-2014” in a Colloquium at Ruhr Universität Bochum in Germany. My message was that energy and industry policy must join hands to generate a value chain that can produce a viable energy technology industry. “Energy” and “energy policy” were of course unknown concepts in 1767, but the deployment efforts of the Swedish Council of the Realm (Riksråd) inspired craftsmanship and an evolving industry for tiled stoves. The stoves of Rörstrand still are very efficient even with today’s standards, and catch high prices in the antiquities market. The company, founded in 1727, is one of the oldest existing porcelain manufacturers in the world.
The Swedish deployment programmes for hydropower in the first half of the 20th century and for nuclear power in the second half created a strong industrial base of which ASEA, today in ABB, is the crown jewel. However, when it comes to the renewable technologies of the 21st century, Sweden missed the train in spite of all its spending on Research and Development.
At this point I was interrupted by a member of the audience who pointed out that Sweden in latest years shows a remarkable growth in the deployment of wind power. My answer was that Sweden is indeed a “Schlusslichter”, which is a powerful German word suggesting someone running up on the railway platform just to see the blinking red lights on the last wagon disappear behind the first curve. And in the case of wind power, the Danes run the locomotive.
The IEA report “Net Zero by 2050 – A Roadmap for the Global Energy Sector” represents impressive and frontline energy modelling. It softlinks well-established models and provides detailed milestones for technologies and systems to reach Net Zero by 2050.
However, milestones are not policy documents. What concrete measures, and when, are needed to provide the cost-efficient technologies and systems in time for the milestones? Considering the espoused goal of setting out the policies to reach Net Zero the IEA Secretariat appears as “Schlusslichter” on the global platform. The curve behind which the blinking lights of the last wagon disappear even has a name. It is called the learning curve.
In the wider perspective, the learning curve is the game changer. It responds to the now proverbial “It is the Economy, stupid!”, which is a good characterization of the transition to Net Zero. For policy design the learning curve takes centre stage because it shows how to cut costs and build industries.
Click image to enlarge
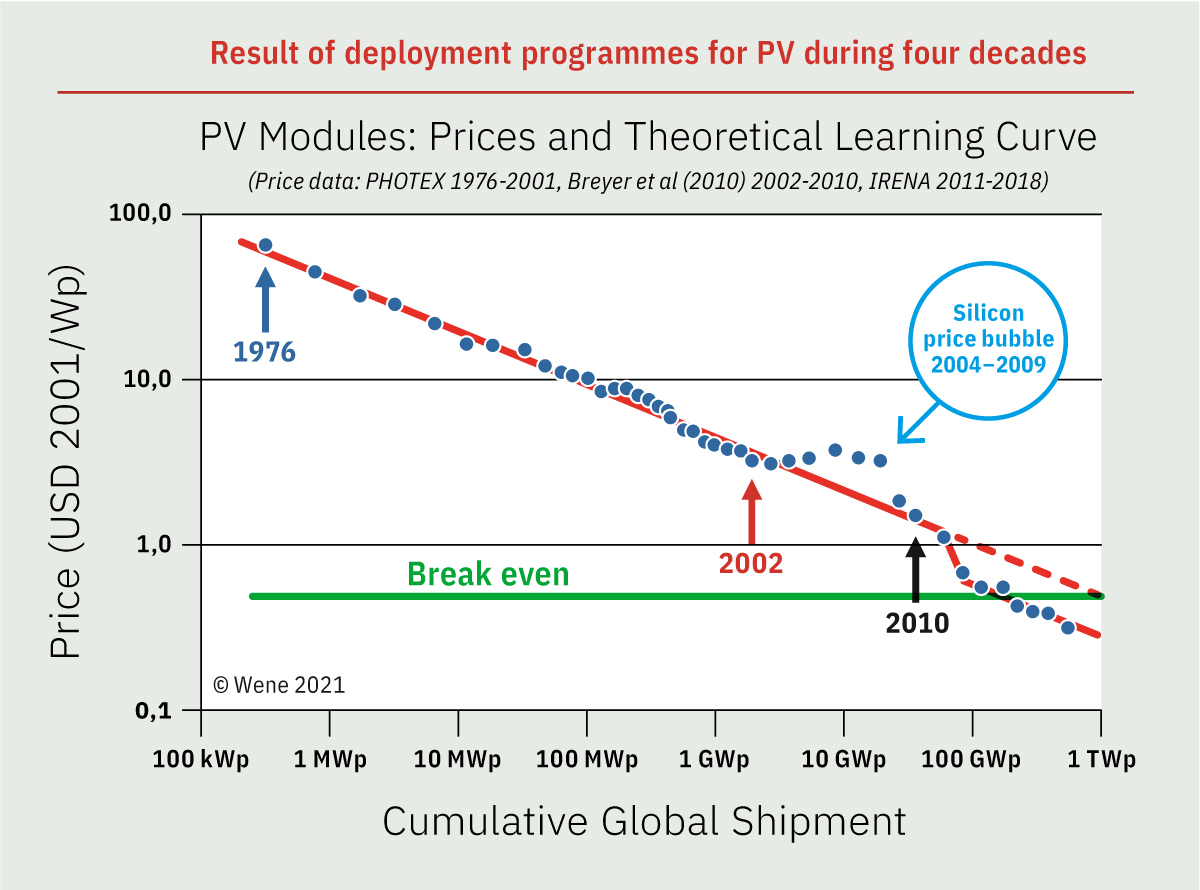
The learning curve for PV modules illustrates both the dynamics of the learning curve and the requirements to ride the curve. Price is a function of cumulative global deployment. After four decades of deployment solar PV is now commercial in global markets. Cumulative deployment has gone from a few hundred kW to almost 1 TW, driving down prices from 70 USD(2001)/Wp to 0.5 USD(2001)/Wp. [1] Deployment has been like a global relay race, notably involving Japan, USA, Germany, Italy and China.
The green line marked “Break even” indicates the module price where solar PV becomes cost competitive in global electricity markets. The area between the learning curve (red line) and the green break-even line indicates the learning investments needed to buy down the price. It is in this case of the order of hundreds billion dollar. Resources are provided, e.g., over government budgets or electricity bills. Mainstream economists refer to these resources as “subsidies”, however, they are investments in learning. The German Erneuerbare-Energien-Gesetz (EEG) shows how the learning effect can be built into the law.
The red line is a theoretical learning curve. It explains observations, but there are two surprises. The silicon bubble 2004-2009 is the result of successful but not coordinated deployment programmes boosting growth but also silicon shortage and price hikes. The bubble therefore indicates the need for concerted action among governments. The industry reacted by building factories dedicated to PV-grade silicon and this upstream integration resulted in a parallel displacement of the learning curve between 2011 and 2012 towards less cost. [2]
Without governments interventions in the markets through deployment programmes we would not have commercial solar PV today. Government public research and development provides no shortcuts. The learning curve theory challenges mainstream economic theory and legitimizes deployment programmes as efficient and indeed necessary measures to manage the climate crisis.
The learning curve is pervasive. It applies to all autonomous technology learning systems. For instance, measurements show that Li-ion battery technology has the same learning rate as PV modules. Government deployment programmes have focused on the electric car, but the industry has here grabbed the relay and is forcefully providing the necessary learning investments.
So where in all this do we find the IEA Roadmap? The learning curve is never mentioned in the report. The expression “Learning-by-doing” appears twice. Ken Arrow used this expression in his seminal paper from 1962 but restricted his analysis to effects of “Labour” on performance. The learning curve for total costs that we discuss here has a much more dramatic and profound effect on technology systems. [3] The word “deployment” is used throughout the report, but only in seven cases as a possible agent for cost reductions and technology improvements.
The absence of the learning curve is surprising considering the role of Energy Technology Perspectives (ETP). ETP is one of the two IEA “flagship series” behind the report and has extensively used learning curves in the past.
The key policy message from the learning curve is that today’s deployment locks in tomorrow’s options. This means that a technology appearing on a milestone calls for deployment programmes to start decades earlier. Ignoring the policy message makes even the most elaborate Roadmap slowly but surely unattainable. Drunkard’s walk or corporate decisions or Imperial visions will always lead to somewhere but not necessarily to the “where” of the Roadmap.
In conclusion: Ignoring the message from the learning curve will put us in a landscape of milestones without roads leading to those checkpoints. The IEA Roadmap is without roads.
------
Footnotes
[1] To set this deployment growth in perspective: The PV module diagram originates from 1998 when accumulated production was about 850 MWp. That the diagram twenty years later would have to be extended to 1 TWp would at that time be considered pure science fiction.
[2] The parallel displacement of the learning curve is discussed in IEA(2000), Experience Curves for Energy Technology Policy, pp. 33-34 and p. 48.
[3] "Learning curve” is a general term. “Experience curve” may be used to distinguish the learning curve for cost.
Other columns by Clas-Otto Wene
Share this on social media


